Every lecture is like a journey

In the “Google Earth and Virtual Visualizations in Geoscience Education and Research” book edited by Steven Whitmeyer it is said about various tools, including the XTools Pro Export Data to KML and Import Data from KML tools, used to visualize geoscience education and research processes.
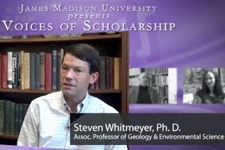
Dr. Steven J. Whitmeyer, Associate Professor at James Madison University (VA, USA)
Specialization: Structural Geology and Tectonics
Author of various books, field guides and articles about geology and applied science
Dr. Steven J. Whitmeyer has been conducting his geologic research of the Appalachians of Eastern North America (Blue Ridge), Caledonides of Ireland, Eastern Sierras Pampeanas of Argentina for several years. The primary focus of his research work is on tectonic development and stratigraphy, as well as on modeling the geologic changes through time. Besides telling various breathtaking stories about his geologic expeditions to Ireland and other places, which are always eagerly anticipant by the students, Dr. Whitmeyer makes every lecture interactive and demonstrative. The combination of Google Earth and KML has opened up the possibilities that previously only existed for those with knowledge of, and access to, proprietary applications (e.g., ArcGIS). “Geology is an exciting and dynamic science but it can also be limited in the classroom by the fact that traditional information resource cannot always convey the scope and setting of landscapes and geologic features. The use of virtual field experiences, especially those based in Google Earth can remove that limitation and provide a proxy for field trips that are not logistically feasible”, says Steven J. Whitmeyer. The modern visualization technologies allow students to learn about different research works without personally being in the fields. The interactive maps created using the geotagged images allow better describe and visualize the real-world mirror landscape. For example, his students can have a virtual field trip around the volcanoes of Tenerife, Spain, watch the weather changes of the ocean and atmosphere environment, or explore the eighteenth century route of military march into Canada to find out how the landscape influenced the path taken.
In the “Google Earth and Virtual Visualizations in Geoscience Education and Research” book edited by Steven Whitmeyer it is said about various tools, including the XTools Pro Export Data to KML and Import Data from KML tools, used to visualize geoscience education and research processes. “To export point, line and polygon shapefiles out of ArcGIS 9.2 we used a combination of a free ESRI ArcScript called Export to KML and a free-based extension called XTools Pro”, - say Meg E. Stewart and Kimberly Baldwin from University of West Indies, Cave Hill campus, Barbados. Particularly these tools were used while creating the map of Grenadines Islands and marine resources. More than 400 geotagged images and videos have been collected and converted to KML-files to create this map.
Being a Member of American Geophysical Union, Geological Society of America, and National Association of Geoscience Teachers, in his publications Steven Whitmeyer also focuses on issues related to the GIS-professionals training and upgrade of the field geology education programs based on the recent GIS-technologies, modern approaches, and trends. Today there is no need to be a GIS-specialist or to have programming skills to create your own GIS-applications and thematic maps. Google Earth provides a canvas to which users can add their own geospatial data to create dynamic visualizations using Keyhole Markup Language. This data allows learning the Earth evolution history by visualizing various temporal changes, for example, to explore landscapes shaped by active tectonic processes. Such combination of terrain and land coverage data offers a whole world for students, teachers, researchers, or anyone to explore our planet.