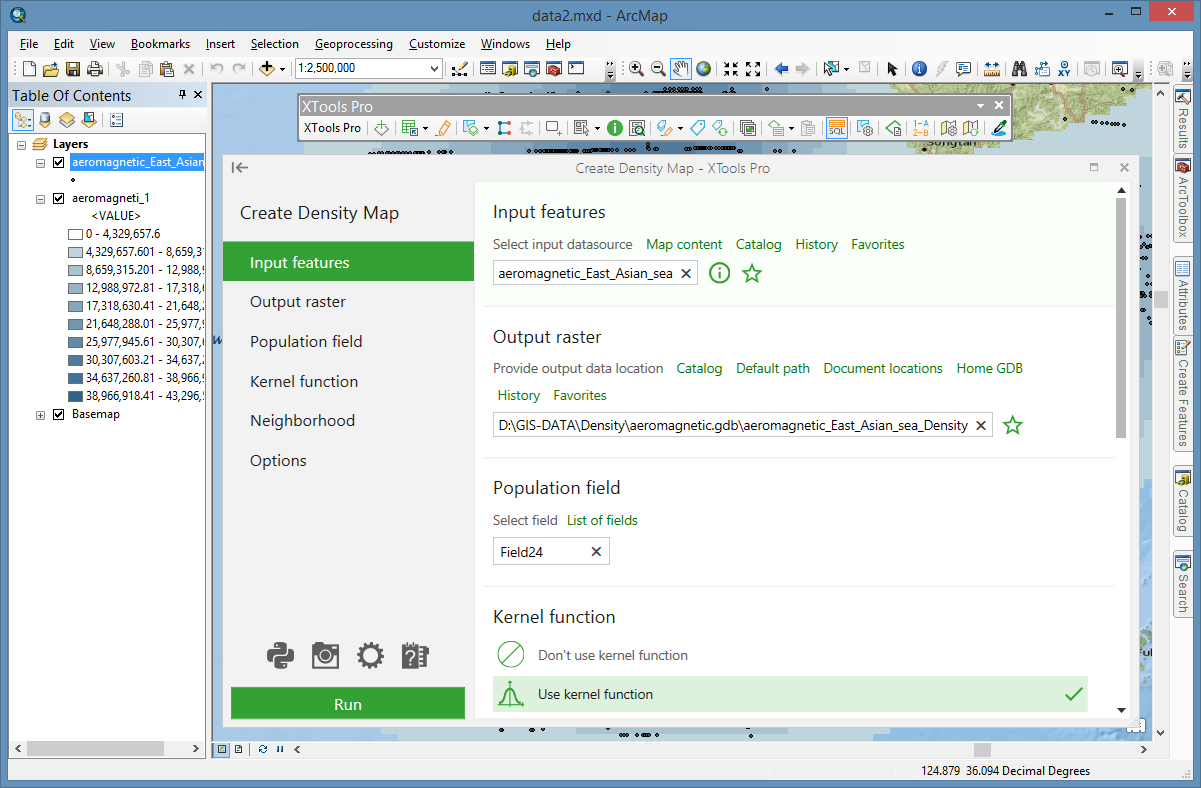
Create Density Map
Calculates density rasters for point and polyline features in specified neighborhood.
 Available in XTools Pro for ArcMap
The “Create Density Map” tool in XTools Pro calculates number of points or polylines within the neighborhood of each cell per area unit. Neighborhood around the center of each raster cell is defined, and then the number of points within this neighborhood is calculated and divided by the neighborhood area. Default output raster format can be specified (see XTools Pro Options).
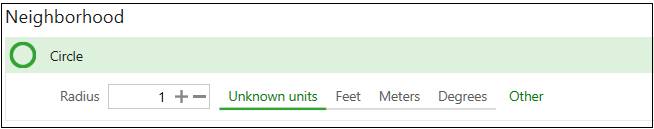
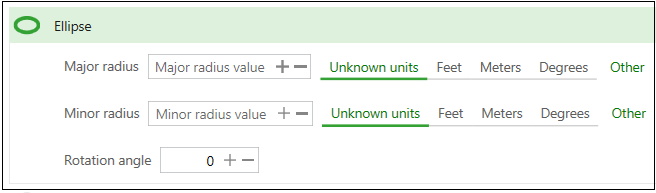
Neighborhood forms and descriptions
Neighborhood defines the area form around each cell used for density value calculation:
- Circle — circular neighborhood with specified radius.
- Ellipse — elliptical neighborhood with specified major/minor radius and rotation angle.
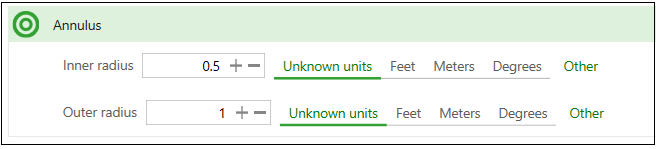
- Annulus — torus neighborhood defined by inner radius and outer radius.
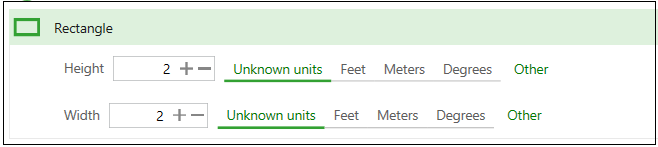
- Rectangle — rectangular neighborhood with given width and height.
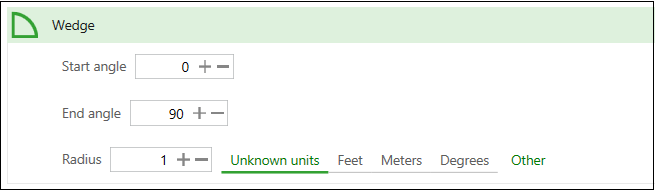
- Wedge — pie neighborhood specified by start angle, end angle, and radius. The wedge extends counterclockwise from the starting angle to the ending angle. Angles are specified in arithmetic degrees (counterclockwise from the positive x-axis). Negative angles may be used.
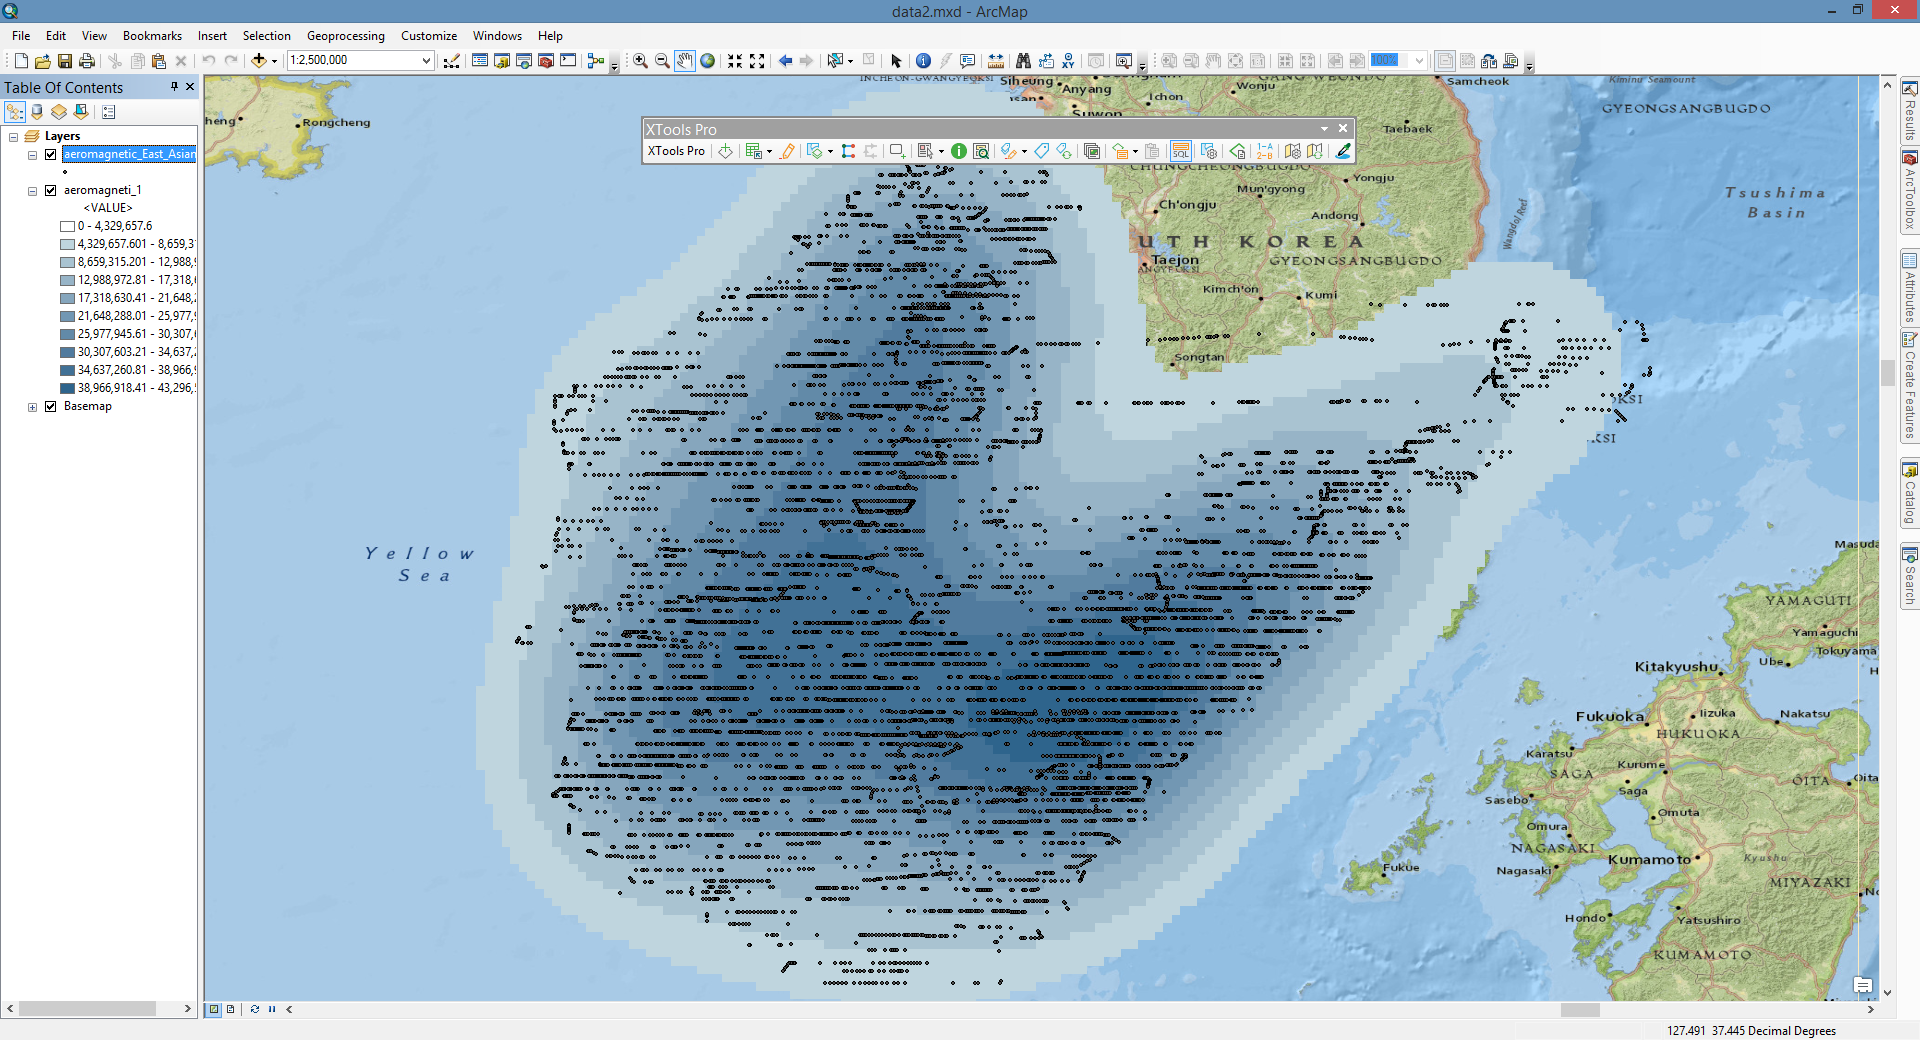
You can use the tool when you need to define specified urban area density, road density, to analyze the high-crime areas, etc.
 Paid tool. Try this and all other XTools Pro features free for 14 days or buy XTools Pro license now.